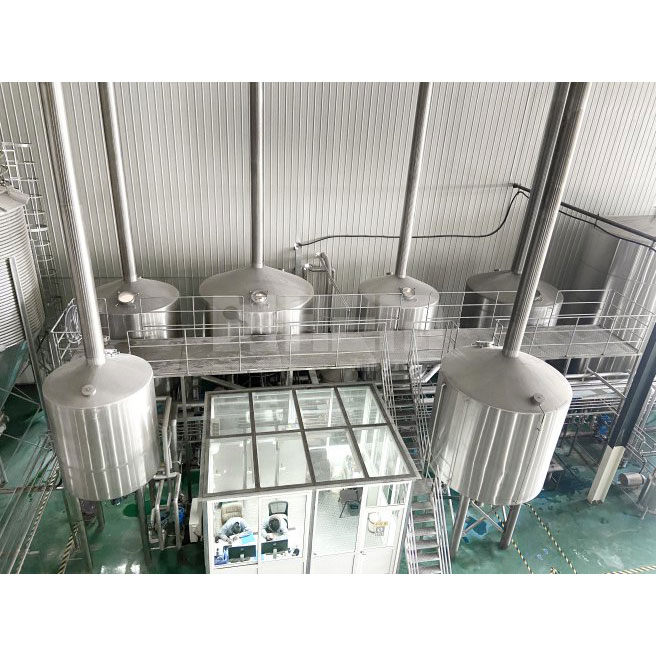
Better brewing equipment improves productivity by shortening batch cycles, raising vessel utilization, reducing product loss, and lowering labor, water, and energy use per barrel. A 20-bbl brewhouse completing four turns instead of three increases theoretical daily wort output from 60 to 80 bbl, a 33% increase without enlarging batch size. Equipment selection also affects operating cost: the U.S. Department of Energy has cited roughly 50–66 kWh of energy use per barrel of beer, while Brewers Association benchmarking separates breweries into performance quartiles for electricity, water, natural gas, CO₂, and waste. Productivity therefore depends on usable output per hour, not tank volume alone.
Brewhouse configuration sets the first production limit. A two-vessel system may combine mash/lauter operations in one vessel and kettle/whirlpool functions in another, keeping capital cost and floor-space requirements moderate. A three- or four-vessel arrangement separates more operations, allowing the next mash or lauter cycle to start while wort from the previous batch is boiling or moving through the whirlpool. For a brewery producing 20 bbl per turn, moving from three to four completed turns raises theoretical daily wort production by 20 bbl, or 33%, before fermentation capacity is considered.
That extra turn depends on transfer and heating time as much as vessel count. A pump moving 100 L/min needs about 20 minutes to transfer 2,000 L under ideal conditions; at 60 L/min, the same nominal volume takes more than 33 minutes. Pipe diameter, elevation, valve restrictions, pump curves, solids content, and required flow control alter the real figure. Saving 10 minutes across six transfers removes one hour from a production day, so pumps and piping should be sized around the complete batch schedule rather than tank capacity alone.
Nameplate brewhouse volume describes how much liquid equipment can hold. Brews per day describe how much production time the brewery can actually sell.
Heating creates another scheduling constraint because mash water preparation and wort boiling occupy equipment while consuming substantial thermal energy. U.S. Department of Energy information states that about two-thirds of end-use energy in food and beverage manufacturing plants is associated with manufacturing processes such as process heating. Historical ENERGY STAR brewery research also estimated average U.S. brewery fuel use at about 212 kBtu per barrel and electricity use at approximately 30.5 kWh/hL, although plant size and equipment configuration produce large differences.
A properly sized steam supply, jacket area, condensate system, and kettle can shorten waiting periods between filling and boiling. Historical brewery efficiency studies reported primary-energy savings of 16–18 kBtu/bbl for thermal vapor recompression and up to 32–40 kBtu/bbl for low-pressure wort-boiling approaches under the configurations studied. Those figures should not be treated as guaranteed savings for a modern craft brewery, but they show why the kettle cannot be evaluated separately from the steam system.
Cooling follows boiling, so heat removed from wort can become useful energy rather than waste. A plate heat exchanger can cool wort while incoming brewing water absorbs part of its heat and moves to a hot-liquor tank. The U.S. Department of Energy estimates that industrial facilities can lose 20–50% of energy input as waste heat across industrial processes, which explains the financial interest in recovery systems. Historical brewery studies assigned wort-cooling heat recovery about 17 kBtu/bbl of primary-energy savings in studied applications.
Faster wort production only helps when fermentation capacity can receive it. Consider a 20-bbl brewhouse producing four batches per day: theoretical brewhouse output is 80 bbl. If the brewery has eight 40-bbl fermenters and each requires two brews to fill, the cellar can accept only 320 bbl before every fermenter is occupied. At a 14-day average tank cycle, brewhouse speed soon becomes less relevant because available tank-days, not kettle capacity, control weekly production.
Tank utilization can be improved through reliable glycol cooling, properly positioned temperature sensors, automated control valves, pressure monitoring, and recipe-based fermentation control. Reducing an average tank cycle from 15 days to 14 increases theoretical annual cycles from about 24.3 to 26.1, roughly a 7% increase in annual turns. The calculation does not justify rushing fermentation; it shows why avoiding unnecessary waiting after beer has met specification can release meaningful cellar capacity.
A well-designed craft brewery system should therefore match brewhouse turns with fermenter volume, cooling capacity, bright-tank availability, and packaging schedules. Installing a 40-bbl fermenter beside a 10-bbl brewhouse, for example, requires four brews to fill one tank. At three hours per brew, filling can occupy about 12 production hours before cleaning or interruptions are counted. A 20-bbl brewhouse needs only two turns for the same fermenter, changing labor scheduling and tank-fill time substantially.
| Equipment area | Production measurement | Example operating effect |
|---|---|---|
| Brewhouse | Turns per day | 3 to 4 turns = 33% more theoretical daily wort |
| Wort transfer | 2,000 L at 100 vs. 60 L/min | 20 vs. 33+ minutes |
| Fermenter | 15-day vs. 14-day cycle | About 7% more theoretical annual turns |
| Filler | 20 vs. 40 cans/min | 1,200 vs. 2,400 cans/hour before stops |
| Product yield | 95% vs. 97% | 100 bbl difference per 5,000 bbl produced |
Cellar capacity then connects directly to cleaning capacity. A fermenter cannot receive another batch until the previous beer is transferred and the vessel completes its cleaning cycle. A 90-minute CIP process performed on 10 vessels consumes 15 equipment-hours; reducing an equally effective validated cycle to 70 minutes removes more than three hours from the same cleaning workload. Chemical concentration, temperature, mechanical action, flow, soil level, and contact time still have to meet the brewery's sanitation requirements, so shorter cleaning cannot simply be assumed to be better.
CIP equipment can reduce operator involvement through repeatable rinse, chemical circulation, and final-rinse stages. Fixed spray devices, suitable return pumps, temperature measurement, chemical dosing, and conductivity measurement can make cleaning more repeatable than manually timed hose work. MBAA technical literature has also discussed acid-and-detergent cleaning of bright tanks as an approach that, in appropriate applications, can allow tanks to remain under pressure and reduce some CO₂ purging, cooling, and re-carbonation work associated with other procedures.
Cleaning efficiency also affects water demand. Brewers Association benchmarking covers water, electricity, natural gas, purchased CO₂, and solid waste, using production bands from below 1,000 bbl/year through more than 100,000 bbl/year. The organization notes that submitted benchmarking figures are self-reported and not independently validated, an important limitation when comparing one brewery with another. A plant should therefore compare its own liters of water per liter of packaged beer month by month rather than copying a single industry number.
Product loss provides another measurable equipment metric. If a brewery produces 5,000 bbl but packages 95%, saleable volume is 4,750 bbl. Raising packaged yield to 97% produces 4,850 bbl, adding 100 bbl from the same gross production. Better tank geometry, shorter transfer routes, appropriate pump control, accurate level measurement, low-loss filtration, and reduced beer left in hoses or vessels can contribute to that difference.
A 2% yield improvement on 5,000 bbl is equivalent to 100 bbl of additional packaged beer; no extra brewhouse batch is required to create that saleable volume.
Once beer reaches the bright tank, packaging equipment can replace the cellar as the production limit. A filler operating at 20 cans per minute has a theoretical rate of 1,200 cans per hour; at 40 cans per minute, it reaches 2,400. Real output is lower whenever operators stop for lid supply, foam adjustment, label changes, seam checks, rinsing, case packing, or maintenance. A line rated at 40 cans per minute but running only 45 minutes of every scheduled hour delivers no more than 1,800 cans during that hour, or 75% of its nominal hourly capacity.
Packaging quality matters alongside speed. MBAA's 2026 Packaging Technology curriculum specifically includes high-speed automation, oxygen management, line efficiency, dissolved-oxygen troubleshooting, and packaging operations, reflecting how closely quality and throughput are connected at this stage. A faster filler provides little production benefit if poor fill control, closure problems, or oxygen pickup causes additional holds, inspections, or rejected product.
Labor requirements change for the same reason. A manual process may require an operator to start pumps, position hoses, adjust valves, record temperatures, monitor tank cooling, and manually time cleaning stages. PLC-controlled equipment can store temperature setpoints, operate valves, regulate pumps through variable-frequency drives, record process data, and issue alarms. If automation removes 30 minutes of routine operator attention from four daily batches, two labor-hours become available for yeast handling, quality checks, cleaning, maintenance, or packaging work.
Automation also creates comparable production records. Recording mash temperature, transfer duration, kettle heating time, knockout temperature, fermentation temperature, pressure, CIP duration, and packaging output allows operators to compare one batch with another. MBAA's 2026 brewing-focused Six Sigma program specifically addresses production metrics including extract yield, dissolved oxygen, packaging waste, and process variability, showing the industry's increasing use of measured process data rather than informal observation alone.
Utilities should be measured in the same way. The U.S. Department of Energy cited roughly 50–66 kWh of energy per barrel of beer in a 2021 overview, while Brewers Association benchmarking shows wide performance ranges among breweries. A brewery increasing packaged output by 20% while electricity consumption rises only 8% has improved electricity use per unit of product, even though the monthly power bill may be higher.
Equipment layout affects whether those gains continue as production grows. Installing six fermenters with space, glycol distribution, electrical service, controls, and piping provisions for another four can reduce later installation work. The same principle applies to steam capacity, hot-liquor storage, cold-liquor storage, compressed air, CO₂ distribution, drainage, and packaging utilities. Adding a tank is relatively simple; replacing an undersized utility system serving 10 tanks can interrupt production across the cellar.
Equipment purchasing therefore works better when the brewery tracks brews per day, brewhouse yield, transfer minutes, tank-days per batch, CIP minutes, packaged yield, cans or bottles per operating minute, downtime percentage, labor-hours per barrel, water per barrel, and energy per barrel. A 15% packaging loss in available production time calls for a different investment than a 15% shortage of fermentation capacity, even when both facilities report the same annual barrel target.
A larger brewhouse is not automatically the productive choice. If a 20-bbl system operates at 55% scheduled utilization because fermentation tanks are full, increasing it to 30 bbl leaves the original scheduling restriction in place. If the same brewery has adequate cellar space but cannot complete enough turns because heating, lautering, transfer, or cleaning takes too long, changes to the brewhouse and supporting utilities can increase usable output without adding cellar tanks. Equipment productivity is therefore best measured as saleable packaged beer per unit of time, labor, water, energy, and installed capacity, with each investment tied to a measured production constraint.